Sample
In total, 313 individuals consented and started the study. Respondents who stopped the survey before answering any questions about any of the treatment types were excluded (N = 85; 27%), leaving 228 respondents included in the analyses. Respondents without an ADHD diagnosis, who scored below the cut-off (i.e., clinically elevated symptoms) of 65 on all CAARS T-scores were excluded from analyses (N = 1), resulting in a final sample size of 227. The sample was on average 34.4 years of age (Min: 18, Max: 79, SD: 11.4). The majority of the sample was female (N = 139; 61%), from Europe (N = 178; 78%) or North America (N = 42; 19%), and achieved a tertiary level of education (N = 190; 84%). The most common daily occupation was computer/office work (N = 104; 46%), followed by working with people (N = 78; 34%), studying (N = 77; 34%), creative work (N = 35; 15%), physical work (N = 17; 7.5%), and travelling (N = 6; 3%). The far majority of the sample had previously been diagnosed with ADHD (N = 205; 90%) (see Table 1). Sixty-two percent indicated that they were diagnosed in the past by a medical doctor, therapist, or psychiatrist with a disorder other than ADHD (N = 140; 62%). Almost sixty percent of the sample had been diagnosed with more than one diagnosis (N = 133; 59%). Furthermore, just over half of the sample indicated that they recognized a disorder in themselves without ever receiving an official diagnosis for this (N = 127; 56%). See Table 1 for the sample’s information regarding (self-)diagnoses.
Of the ADHD-diagnosed individuals (N = 205), the majority was diagnosed after the age of 24 (N = 121; 59%). Most ADHD-diagnosed individuals experienced symptoms before the age of 12 (N = 178; 87%), eleven percent could not remember (N = 23; 11%), and the remaining individuals did not experience ADHD symptoms before the age of 12 (N = 4; 2%). Sixty-two percent of the ADHD-diagnosed individuals had at least one additional diagnosis alongside the ADHD diagnosis (N = 128; 62%).
Ten percent of the entire sample did not have an official ADHD diagnosis but scored above the used CAARS-S:SV cut-off indicating clinically elevated symptoms (N = 22; 10%). Almost half of these individuals did not have any official diagnosis of any kind (N = 10; 46%), one-third had one official diagnosis of a disorder other than ADHD (N = 7; 32%), and just over twenty percent had at least two official diagnoses other than ADHD (N = 5; 23%).
ADHD symptom severity
See Table 2 for the raw CAARS-S:SV scores for the whole sample, ADHD-diagnosed individuals, and individuals without an official ADHD diagnosis. Four individuals with an official ADHD diagnosis did not complete all CAARS-S:SV items, leading to missing subscales scores. Independent samples t-tests indicated higher ADHD symptom severity for individuals without an official ADHD diagnosis on the CAARS-S:SV hyperactivity/impulsivity and on the DSM-IV total symptoms subscales.
Conventional treatments
The majority of the sample had used a form of conventional (non-)pharmacological ADHD treatments in their life (N = 207; 91%). Eighty percent of the sample were currently using a type of conventional treatment (N = 182; 80%).
Conventional pharmacological treatments
The majority of the sample had used conventional pharmacological ADHD treatments in their life (N = 192; 85%), with eighty-three percent of those who ever used ADHD medication presently using them (N = 159; 83%), which was seventy percent of the total sample. See Table 3 for the prevalence of lifetime and current uses of the assessed ADHD medication types.
Lifetime experience of negative effects
The majority of those who had ever used conventional pharmacological treatments experienced negative effects from them (N = 153; 80%). Relatively most negative effects were experienced from methylphenidate; with seventy percent of those who ever used methylphenidate indicated that negative effects were experienced (N = 109; 70%), with loss of appetite (N = 50; 46%), irritability/mood swings (N = 45; 41%), and anxiety (N = 42; 39%) most commonly experienced. Sixty percent of individuals who ever used lisdexamphetamine indicated that they experienced negative effects (N = 40; 61%), with loss of appetite (N = 20; 50%), sleeping problems (N = 16; 40%), and weight loss (N = 14; 35%) most commonly experienced. See the supplementary materials for the prevalence of lifetime experiences of negative effects for each specific medication type (Table S1) and for all negative effects per medication type (Table S2).
Other prescribed medication
Almost one-third of respondents were currently using prescribed medication other than ADHD medication (N = 63; 28%), including antidepressants (N = 40; 18%), benzodiazepines (N = 10; 4%), and antipsychotics (N = 5; 2%).
Conventional non-pharmacological treatments
Sixty-two percent of the entire sample had ever used conventional non-pharmacological (i.e., psychological treatments) (N = 140; 62%), and half of those were currently using them (N = 71; 51%), which was thirty percent of the total sample. See Table 3 for the prevalence of lifetime and current uses of the assessed non-pharmacological treatments.
Lifetime experience of negative effects
Fourteen percent of those who ever tried a form of psychological therapy experienced negative effects from them (N = 20; 14%). Fifteen percent of those ever using CBT, reported experiencing negative effects (N = 16; 15%), with anxiety (N = 9; 56%), irritability/mood swings (N = 7; 44%), and emotional flattening (N = 5; 31%) reported most frequently. See the supplementary materials for the prevalence of lifetime experiences of negative effects per conventional non-pharmacological treatment type (Table S3) and for all negative effects per type (Table S4).
Associations between conventional treatment use and having an official ADHD diagnosis, ADHD symptom severity, number of diagnoses, and sex
A significant association was found between having an official ADHD diagnosis and lifetime use of conventional pharmacological (X2 (1, N = 227) = 106.45, p < 0.001, φ = 0.69) and non-pharmacological treatments (X2 (1, N = 227) = 9.19, p = 0.002, φ = 0.20). Participants with an official ADHD diagnosis were more likely to have used both conventional treatment types in their lifetime. Furthermore, lifetime use of conventional pharmacological treatments was related to ADHD symptom severity (r(223) = -0.14, p = 0.040). Those with lower ADHD symptom severity, were more likely to have ever used conventional pharmacological treatments.
Current use of conventional pharmacological treatments was related to having an official ADHD diagnosis (X2 (1, N = 227) = 49.81, p < 0.001, φ = -0.47). Those with an ADHD diagnosis were more likely to be currently using these treatments. In addition, current use of conventional non-pharmacological treatments was related to the number of diagnoses (r(227) = 0.15, p = 0.021). Those with more diagnoses were more likely to be currently using a form of conventional non-pharmacological treatment.
Lifetime experience of negative effects from non-pharmacological treatments was related to having an official ADHD diagnosis (X2 (1, N = 140) = 4.91, p = 0.027, φ = 0.19) and the number of diagnoses (r(140) = 0.20, p = 0.021). Those without an official ADHD diagnosis and those with more diagnoses reported more often to have experienced negative effects from conventional non-pharmacological treatments. Please take note that only seven participants indicated ever trying these treatment types, of which three experienced negative effects.
No other associations were found in this context. See Fig. 1 for a visual summary of the results for conventional treatments regarding lifetime and present use, lifetime experience of negative effects, and the associations with ADHD symptom severity, number of diagnoses, and sex.
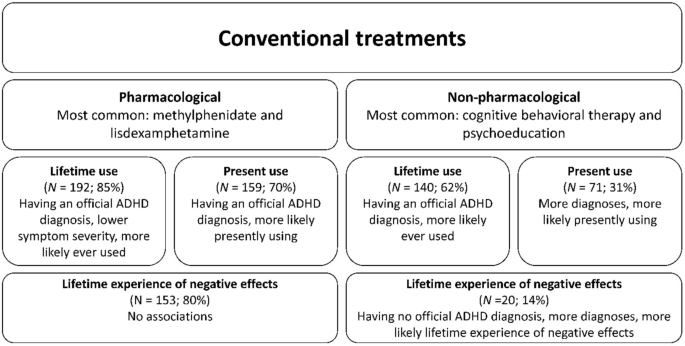
Visual summary of results related to conventional treatments. “No associations” refers to a lack of finding in a relationship between the assessed aspect and sex, number of diagnoses, having an official ADHD diagnosis, and ADHD symptom severity. Percentages for lifetime and present use reflect the proportion of the total sample (N = 227). Percentages for lifetime experience of negative effects reflect the proportion of lifetime users of the particular treatment type who experienced negative effects.
Complementary and/or alternative medicine (CAM)
Over three-quarters of the sample initiated CAM use outside of a medical professional’s recommendation, on their own initiative (N = 173; 76%). Over eighty percent of those who ever used CAM, were presently using it (N = 149; 86%), which was 66 percent of the total sample.
CAM substances
Over sixty percent of the sample had ever used CAM substances (N = 145; 64%), with almost three-quarters of those presently using them (N = 107; 74%), which was just less than half of the total sample (47%). See Table 4 for the lifetime and current uses of CAM substances.
Lifetime experience of negative effects
Sixty-six percent of those ever using CAM substances had experienced negative effects from its use (N = 96; 66%). Only nine percent of respondents (N = 10) ever using dietary supplements indicated ever experiencing negative effects from them, with blood pressure changes most commonly reported by these 10 respondents (N = 3; 30%). Half of the respondents who ever used caffeine to relieve symptoms (N = 93) reported experiencing negative effects (N = 46; 50%), with anxiety (N = 31; 67%), sleep problems (N = 19; 41%), and headaches (N = 16; 35%) most often reported. See the supplementary materials for the prevalence of lifetime experiences of negative effects per CAM substance (Table S3) and for all negative effects per CAM substance (Table S4).
Most influential CAM substance
Of the individuals who were currently using CAM substances (N = 107), sixty-five percent (N = 70; 65%) were using multiple CAM substances simultaneously. The majority of these individuals (N = 53; 76%) indicated that they were able to identify what CAM substance was most influential in producing beneficial effects. Caffeine (N = 14; 26%) and illicit substances (N = 14; 26%) were indicated as most beneficial, with psychedelic substances (N = 10; 71%) and cannabis (N = 4; 29%) most often mentioned within the illicit substance subcategory.
Reasons for using CAM substances
See Table 5 for an overview of the reasons for taking CAM substances reported by current users.
CAM activities
Seventy percent had ever used CAM activities to relieve ADHD symptoms (N = 158; 70%), with three-quarters of those presently using it (N = 120; 76%), which was just over half of the total sample (53%). See Table 4 for lifetime and current uses of CAM activities.
Lifetime experience of negative effects
About twenty percent of those who ever tried CAM activities (N = 158) experienced negative effects (N = 35; 22%). Only ten percent of those who used physical exercise (N = 13; 10%) and meditation/mindfulness (N = 11; 10%) reported experiencing negative effects. The most common negative effects of physical activity were dizziness (N = 5; 38%), injuries or muscle aches (N = 4; 31%), and overtraining (N = 3; 24%), with the latter two being indicated through free text by respondents when asked about negative effects. The most common negative effects associated with meditation/mindfulness were anxiety (N = 9; 82%), irritability/mood swings (N = 5; 82%), and rebound (N = 2; 18%). See the supplementary materials for the prevalence of lifetime experiences of negative effects per CAM activity (Table S3) and for all negative effects per CAM activity (Table S4).
Reasons for using CAM activities
See Table 6 for an overview of the reasons for using CAM activities reported by those who were currently using them.
Most influential CAM activity
Of the individuals who were currently using CAM activities (N = 120), almost seventy percent were using multiple CAM activities simultaneously (N = 81; 68%). The majority of these individuals (N = 56; 69%) indicated that they were able to identify which CAM activity was most influential in producing beneficial effects. Physical exercise was most often reported as the most influential (N = 24; 43%), followed by meditation/mindfulness (N = 11; 20%).
Associations between CAM use and having an official ADHD diagnosis, ADHD symptom severity, number of diagnoses, and sex
Lifetime use of CAM substances was related to ADHD symptom severity (r(223) = 0.16, p = 0.020). Those with higher ADHD symptom severity were more likely to have ever used CAM substances in their lives.
A significant association was found between the present use of CAM substances and ADHD symptom severity (r(223) = 0.26, p < 0.001). Those with higher scores on the CAARS-S:SV ADHD index subscale were more likely to be currently using CAM substances.
Furthermore, an association was found between experiencing negative effects from CAM substances and ADHD symptom severity (r(142) = 0.20, p = 0.016). Those with higher scores on the CAARS-S:SV ADHD index subscale were more likely to have ever experienced negative effects from CAM substances. In addition, a significant association was found between experiencing negative effects from CAM activities and the number of diagnoses (r(158) = 0.17, p = 0.035). Those with more diagnoses were more likely to have experienced negative effects from CAM activities.
No other associations were found in this context. See Fig. 2 for a visual summary of the results for CAM regarding lifetime and present use, lifetime experience of negative effects, and the associations with ADHD symptom severity, number of diagnoses, and sex.
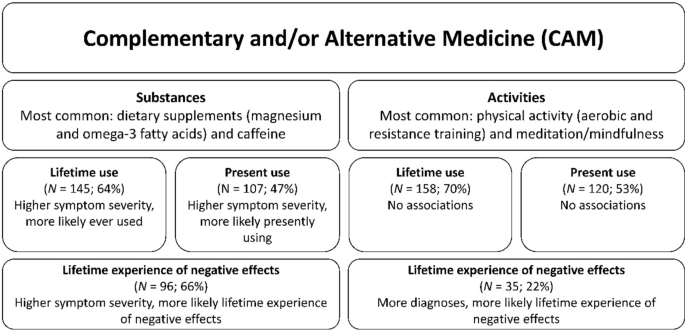
Visual summary of results related to complementary and/or alternative medicine (CAM). “No associations” refers to a lack of finding a relationship between the assessed aspect and sex, number of diagnoses, having an official ADHD diagnosis, and ADHD symptom severity. Percentages for lifetime and present use reflect the proportion of the total sample (N = 227). Percentages for lifetime experience of negative effects reflect the proportion of the lifetime users of the particular treatment type who experienced negative effects.
Self-rated effectiveness (SRE)
CAM compared to conventional treatments
CAM, as a cluster of alternative treatments, was rated by the entire sample as less effective compared to conventional treatments in positively influencing cognition (OR = 0.48; p = 0.023; 95% CI [0.25, 0.91]). There was no significant difference in SRE between CAM and conventional treatments regarding the other domains, concerning whether the treatment ‘works’ (OR = 0.62; p = 0.081; 95% CI [0.37, 1.06]), influencing inattention (OR = 0.54; p = 0.074; 95% CI [0.27, 1.06]), hyperactivity/impulsivity (OR = 1.42; p = 0.129; 95% CI [0.90, 2.24]), motivation (OR = 0.74; p = 0.309; 95% CI [0.41, 1.32]), and timing (OR = 0.78; p = 0.272; 95% CI [0.50, 1.21]). Lastly, there was no difference between treatment clusters in terms of influencing quality of life (OR = 0.48; p = 0.057; 95% CI [0.23, 1.02]), see Fig. 3.
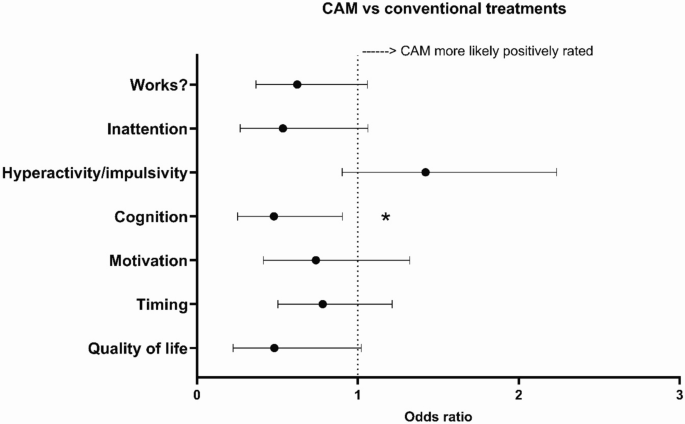
Odds ratios for the self-rated effectiveness (SRE) of complementary and/or alternative medicine (CAM) and conventional treatments. ‘Works?’ = Participants were asked to what extent they felt the current treatment ‘works’. ‘Quality of life’ = Participants were asked to what extent they felt that the current treatment influenced their quality of life. ‘Inattention’, ‘Hyperactivity/impulsivity’, ‘Cognition’, ‘Motivation’, ‘Timing’ = Participants were asked to what extent they felt the current treatment influenced the domains depicted on the Y-axis. Please see the methods section for the exact questions that were asked. The dotted line represents an OR of 1, meaning both treatment types were equally likely to influence the assessed domain. * p < 0.05, ** p < 0.01.
Conventional pharmacological treatments compared to conventional non-pharmacological treatments
The SRE of conventional pharmacological approaches was higher than the SRE of conventional non-pharmacological treatments in four out of seven assessed domains. Namely, regarding inattention problems (OR = 15.97; p < 0.001; 95% CI [3.47, 73.48]), cognition (OR = 3.15; p = 0.029; 95% CI [1.12, 8.84]), motivation (OR = 3.34; p = 0.007; 95% CI [1.39, 8.04]), and quality of life (OR = 4.24; p = 0.025; 95% CI [1.20, 14.98]), see Fig. 4. No differences were found in SRE assessing whether the treatment ‘works’ (OR = 1.95; p = 0.109; 95% CI [0.68, 4.42]) and the influence on hyperactivity/impulsivity (OR = 1.21; p = 0.569; 95% CI [0.63, 2.29]) and timing (OR = 1.02; p = 0.949; 95% CI [0.52, 2.03]).
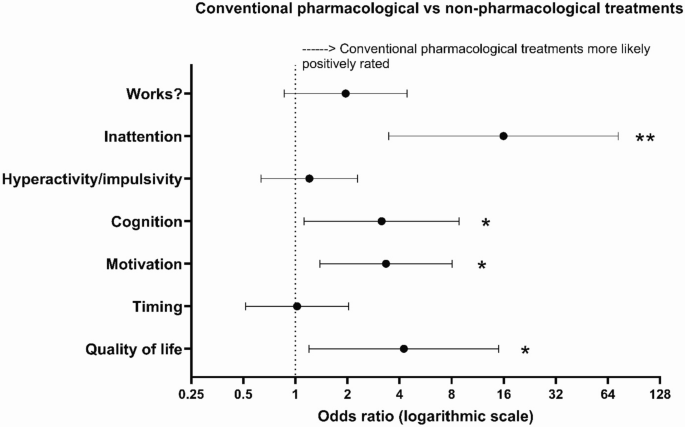
Odds ratios (ORs) for the self-rated effectiveness (SRE) of conventional pharmacological and conventional non-pharmacological treatments. ‘Works?’ = Participants were asked to what extent they felt the current treatment ‘works’. ‘Quality of life’ = Participants were asked to what extent they felt that the current treatment influenced their quality of life. ‘Inattention’, ‘Hyperactivity/impulsivity’, ‘Cognition’, ‘Motivation’, ‘Timing’ = Participants were asked to what extent they felt the current treatment influenced the domains depicted on the Y-axis. Please see the methods section for the exact questions that were asked. The dotted line represents an OR of 1, meaning both treatment types were equally likely to influence the assessed domain. * p < 0.05, ** p < 0.01.
CAM activities compared to CAM substances
The SRE of CAM activities was higher on all seven assessed domains compared to CAM substances. SRE ratings for CAM activities were higher, i.e., more positive, regarding whether the treatment ‘works’ (OR = 2.63; p = 0.001; 95% CI [1.21, 5.52]), influencing inattention problems (OR = 3.04; p = 0.019; 95% CI [1.21, 7.65]), hyperactivity/impulsivity (OR = 6.25; p < 0.001; 95% CI [2.73, 14.29]), cognition (OR = 2.52; p = 0.026; 95% CI [1.12, 5.66]), motivation (OR = 3.41; p = 0.005; 95% CI [1.44, 8.07]), timing (OR = 2.07; p = 0.021; 95% CI [1.11, 3.84]), and quality of life (OR = 5.46; p = 0.003; 95% CI [1.77, 16.80]), see Fig. 5.
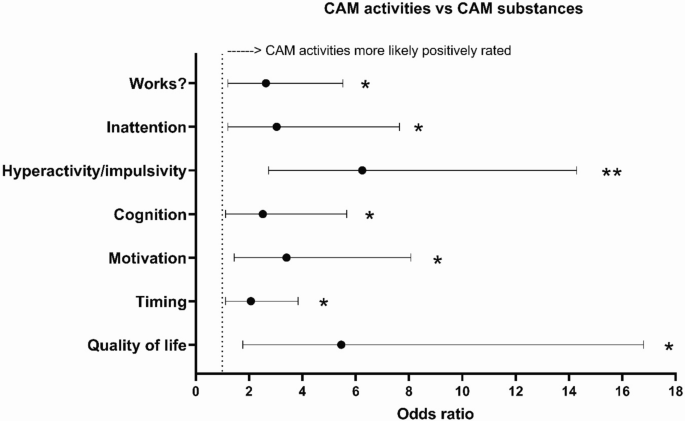
Odds ratios (ORs) for the self-rated effectiveness (SRE) of complementary and/or alternative medicine (CAM) substances and activities. ‘Works?’ = Participants were asked to what extent they felt the current treatment ‘works’. ‘Quality of life’ = Participants were asked to what extent they felt that the current treatment influenced their quality of life. ‘Inattention’, ‘Hyperactivity/impulsivity’, ‘Cognition’, ‘Motivation’, ‘Timing’ = Participants were asked to what extent they felt the current treatment influenced the domains depicted on the Y-axis. Please see the methods section for the exact questions that were asked. The dotted line represents an OR of 1, meaning both treatment types were equally likely to influence the assessed domain. * p < 0.05, ** p < 0.01.
link

